AI & society
The Geography of Hope: The people with the least are the most hopeful about AI
I ran my own analysis of Anthropic's data, looking for why. The strongest clue was in how a country treats its women.
TL;DR
- 81,000 people, 124 countries. Anthropic asked how they'd use AI. I extracted the per-country numbers and ran my own analysis.
- The poorer the country, the more hopeful: national wealth and AI optimism move in opposite directions.
- After wealth, the strongest driver is gender inequality: the least equal places are the most hopeful, and the signal remains when wealth is held constant. Digital finance is third.
- Correlational, not causal, but the signal is real. The most hopeful countries are also the most willing to accept AI's help. That combination is worth acting on.
Anthropic interviewed 81,000 people around the world about how they use AI, and published what it learned. I read the report twice. First as a reader, then as a data scientist. I want to share both readings here.
Ask people how they use AI and you don't really learn about AI. You learn about them. It's like that question we ask each other over dinner: what would you do if money were no object? People stop describing their circumstances and start naming their real hopes. This survey works the same way, because to most people AI still feels like a superpower. Asking how they would use it is really asking what they would want if the usual limits were gone.
If I had to reduce the whole report to one word, it would be hope. If you read the report, you will quickly realize that underneath all the talk of productivity, what people mostly want is to do people things. They want to connect, to spend real time with the ones they love, to care for them. A striking number of people want AI to help them help someone else. This made me like being human in spite of all those tragedies we see on the news. The fears are in there too, but I just notice the hope more acutely.
Then I reached the section on how views differ around the world, which was fascinating to read. The first thing I observed was that the countries with the least treat AI as an equalizing force, and they might be the most willing to accept its help. That's when I thought I should run further analyses using Anthropic's data.
So I extracted the per-country numbers from that map. There is no downloadable dataset and the numbers exist only inside the interactive map, so I parsed them out of the page, with a little help from my friend Claude Code. Then I matched them against all publicly available datasets I could find about those countries: 57 indicators across seven categories, covering wealth, politics, demographics, jobs, digital lives, gender, and culture. Here's what I found out.
Hope and wealth move in opposite directions
First, the poorer a country, the more hopeful its people are about AI (weighted by how many people each country contributed). Peru, Indonesia, India and Nigeria are near the top. The United States, Germany, South Korea and Japan are lower. Income alone explains roughly 43% of the variation between countries. For people who have more to lose, AI is a threat. For people who have more to gain, it is an opportunity.
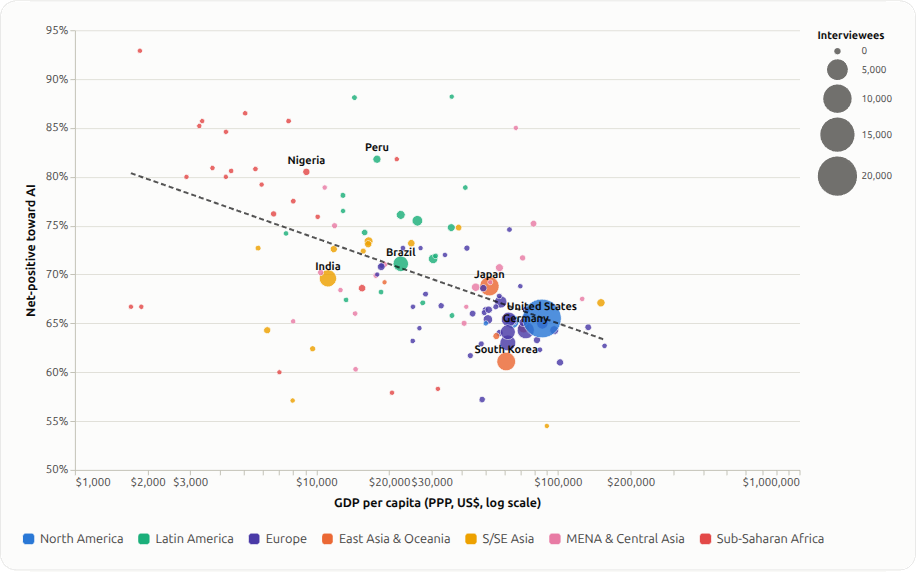
Each bubble is a country, sized by how many people it contributed. Down and to the right: the richer the country, the less positive about AI.
But wealth is only part of the explanation
If wealth were the whole answer, there would be nothing to do but wait for countries to get richer and richer. It isn't. When I added other factors to the model (politics, digital infrastructure, age structure, culture), the share of the variation we could explain rose from about 43% to 61%; in fact, as I will explain later, wealth's power to explain the phenomenon becomes a clear minority when other input variables are included. Some of the other drivers are easy to guess—younger countries are more hopeful, so median age matters a lot. Faster-growing countries are more hopeful too. But the strongest of the remaining drivers was none of those, and it was actually the one indicator I had asked Claude Code to consider before the analysis started.
The variable was GENDER
Years ago, as a postdoc, I worked on a system-dynamics model of the whole world (resources, output, population, wellbeing, lifespan) projected up to the year 2100, and one variable kept turning out to move everything else in the model. I had no idea whether it would matter for something as different as how people feel about AI. But I was curious enough to include it.
That variable was gender inequality. I didn't weight it or tune the method to find it. It went in as one of 57 indicators, treated exactly the same way, and the analysis itself picked it as the strongest signal, after national wealth, of who is hopeful about AI, and it is not an artifact of one index. It shows up in girls' schooling, in women's work, in how mothers fare. What surprised me most is the direction. The more gender-unequal a country, the more hopeful it is about AI.
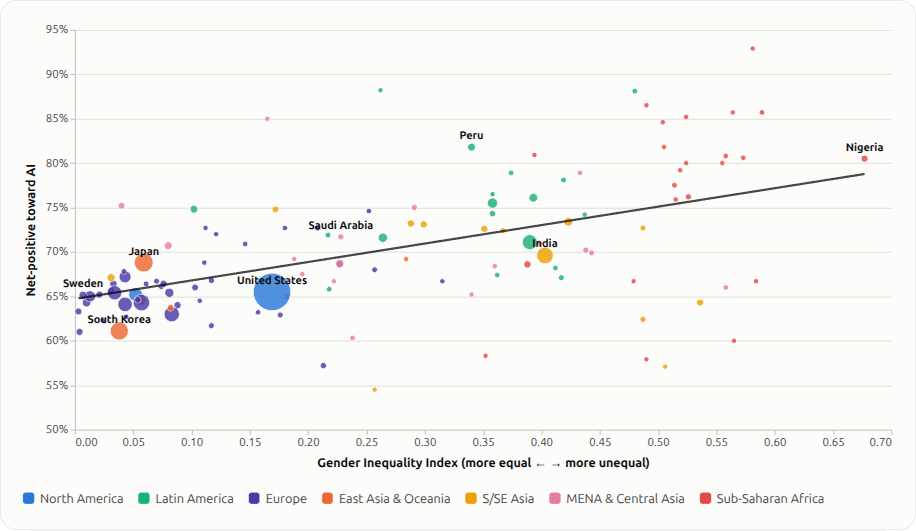
Gender Inequality Index (right = more unequal) against AI optimism. The line rises: the least equal places are the most hopeful. It's the second-strongest driver overall, behind only wealth.
"But isn't that just wealth?"
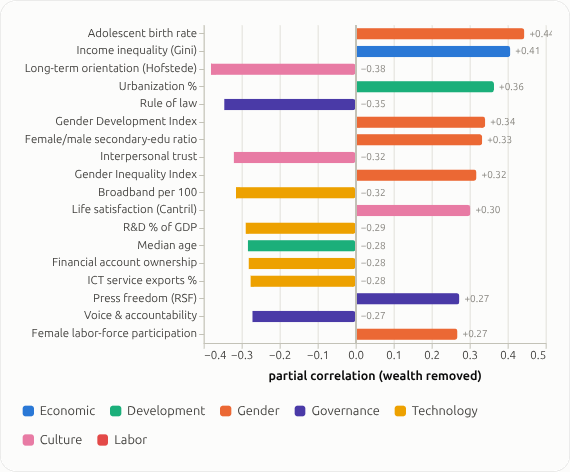
At this point, you may wonder, "But isn't gender inequality just a proxy for wealth?" I'm glad you asked, because it was the first thing I checked. Poorer countries are both more gender-unequal and more hopeful about AI, so gender inequality could simply be poverty measured a second time. It isn't. If you hold wealth constant, comparing only countries at similar income levels, the gender signal still remains. Among equally wealthy nations, the more unequal ones are still the more hopeful. (The formal test, partial correlations with wealth removed, is in the appendix. Gender still ranks near the top.)
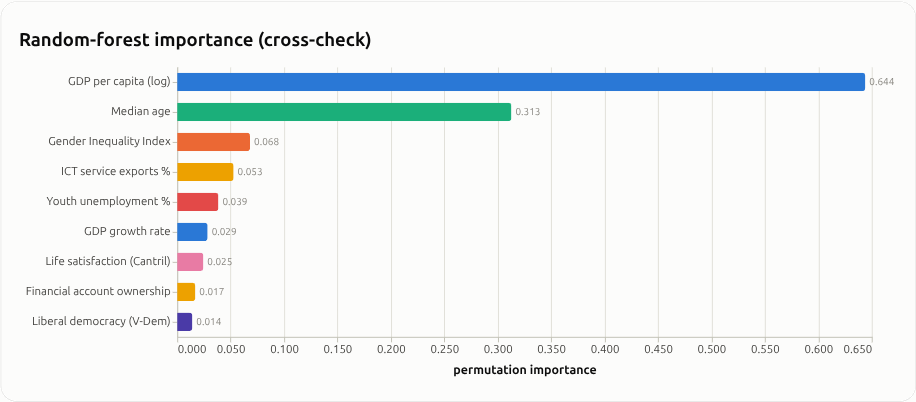
There is a cleaner way to see the same thing, as shown in the chart below. I used a technique called Shapley decomposition: when drivers overlap, it divides the credit fairly by giving each driver only the part it adds that the others cannot already supply, wealth included. Measured that way, wealth still takes the largest share, but only about 25% (the earlier mention of "43%" was the case where you only used wealth to explain the sentiment toward AI, and the measurement was R-squared). Gender inequality's share is nearly as large, and it consists entirely of the part that wealth, age, and the rest couldn't supply.
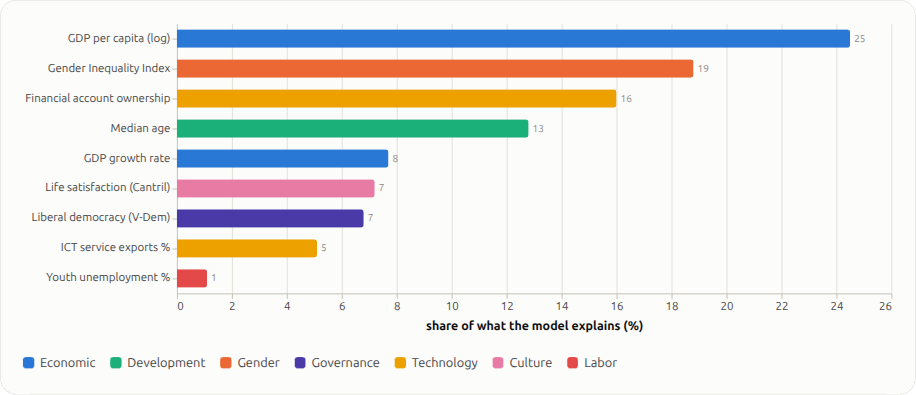
Each driver's share of everything the nine-driver model explains. No single factor dominates: wealth leads, gender inequality is close behind, and the rest fill in the remainder. (The appendix checks the same split against a random forest.)
Note that this does not prove that gender inequality causes the hope. Nothing here proves causation. But it rules out the simplest explanation, and the fact that remains deserves attention: the places least equal for women are also the places most hopeful that a new technology could change things.
There is one limitation I want to point out, and it works in an encouraging direction. The numbers pool men and women into one figure per country, so I never saw women's answers separately. Even when the data is blended, gender inequality ranks just behind wealth. Separate the women out from the data and I'd bet the number climbs, because if AI is an equalizing force, it should matter most to the people who have the most to gain.
The story doesn't end here. Notice that the third-strongest driver is whether a country had already experienced digital finance, meaning mobile money that put a bank account inside a phone before traditional banks arrived. The societies that watched a cheap technology bypass broken institutions are the ones that believe AI will do it again.
That is what the data shows us. Now I want to tell you why this result means so much to me.
The part about women
There is a detail in the mobile-phone story that is usually left out. Dario Amodei's Machines of Loving Grace, the most deliberately hopeful case I have read for what AI could do, points to how mobile phones spread across sub-Saharan Africa through the market. What it does not dwell on is how much of that story was about women: a mother with a phone, savings that nobody else could take, a small business run from home. When economists tracked Kenya's M-PESA across years of household surveys, the households it lifted out of poverty were disproportionately led by women, who used it to keep money of their own and to move from subsistence farming into business.
I don't think gender equality is just one item on a development checklist. I think it is a catalyst. I came to that belief twice. Once through the modeling I mentioned above, and once by direct observation. I lived in a few rural parts of Hawaii and I have known extraordinarily talented young women who gave up their futures under family and social pressure, and every time I heard that story again, it made me wonder how much the world loses. Solve gender inequality and you don't fix a single problem. You start a positive feedback loop that improves the lives of generations to come.
The map is what makes deliberate action practical. The willingness to accept help already seems to be there, and it is strongest in the places that earlier technologies reached last.
A beautiful path
Here is what I take from all of this. The countries this world serves least are the most ready to accept help, and the most hopeful that this time might be different. The same report shows that people in these countries are more likely to talk about using AI to help others. In many of these cultures, people share what little they have with their neighbors. Hope plus generosity is a good foundation.
That combination is rare, and it may not last forever. We could let AI do what most technologies have done and widen the gap. Or we could direct it deliberately toward the people who already want it, so that less-developed countries catch up and keep up instead of falling further behind.
This is not about rich countries losing so that others can win. For most of history, a wealthy nation's rise depended on someone else's cheap labor. AI, and soon robots, might be able to take over that work. The rich world will no longer need to extract cheap labor from the poor world in the form of either colonization or unfair trade. And the poor world, freed from that role, can grow and eventually close the gap.
So, potentially, there is a beautiful path here, and somebody has to try to walk it. Reading 81,000 people's hopes, that is mostly what I came away with—that it's a good time to be a human who wants to help.
Appendix: the technical version
For readers who want the details. Outcome: each country's share of interviewees expressing net-positive sentiment toward AI (Anthropic's 81k-interviews, 124 countries with a value). Every statistic is weighted by respondents per country. Method: respondent-weighted correlations, partial correlations controlling for log GDP per capita, a nine-driver weighted regression, and a Shapley plus random-forest importance decomposition.
67% of people, globally, are net-positive on AI · −0.65 wealth ↔ optimism (weighted correlation) · 43% explained by wealth alone · 61% explained by the full nine-driver model
A1 · Every candidate driver, ranked
Respondent-weighted correlation with AI sentiment. Left of zero = the factor rises as optimism falls. Colour marks the driver family. The strongest correlates are all markers of development, and they point the same way. The optimism gradient is largely a development gradient.
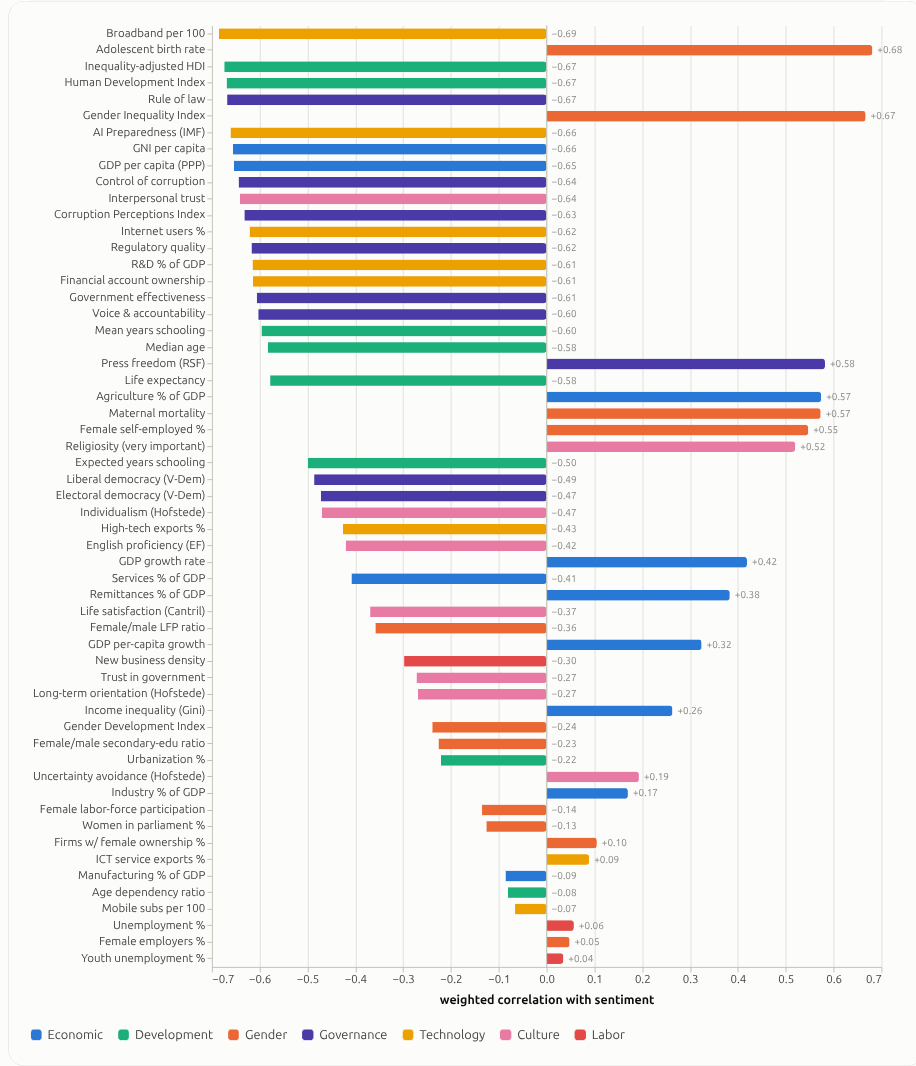
A2 · What survives when wealth is held constant
Partial correlations after removing log GDP per capita from both sides. These are the signals that carry independent information beyond how rich a country is. Gender/demographic regime, inequality, urbanisation and culture lead.
A3 · Are the differences statistically real?
Each correlation above carries a two-sided t-test. The choice that matters: n is the number of countries (~120), not the 81,000 respondents. That's the level the claims are actually made at, and the conservative one (respondent-n would inflate certainty absurdly). On that basis the headline correlations are not marginal: wealth and the Gender Inequality Index each land near p ≈ 10⁻¹⁶, clearing a Bonferroni correction for all 57 predictors (threshold ≈ 9×10⁻⁴) by a dozen orders of magnitude. The harder test is whether gender survives once wealth is partialled out. It does, at p ≈ 4×10⁻⁴, with its health-and-empowerment facets stronger still (adolescent birth rate p ≈ 4×10⁻⁷). Significance means the pattern is real, not that the model forecasts new countries, which is the separate question in A4.
A4 · How the explained variance splits up
A nine-driver weighted model explains 61% of the variation. Because the drivers are correlated, raw coefficients mislead, so the honest ranking is the Shapley decomposition (fair split of shared credit) shown earlier in the piece. As a nonparametric cross-check, a random-forest permutation-importance run agrees on the top tier: wealth, then median age and gender inequality.
One honest note: that figure is in-sample. It describes these 124 countries, not a prediction for new ones. Under five-fold cross-validation it falls to roughly 40% (and the linear model's nearly to zero), because respondent-weighting concentrates the effective sample on a handful of large countries. Read the ranking, not the R², as the result.
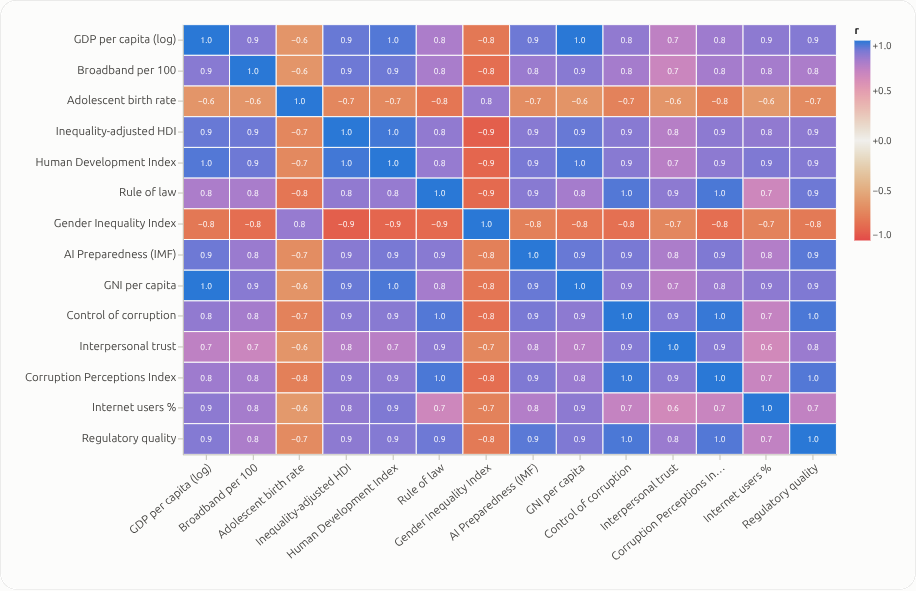
A5 · Why you can't just read the ranking
Almost every driver co-moves with development, so the raw ranking (A1) largely retells one story. This is why A2 and A4 do the real work of separating them. Blue = move together, red = move oppositely.
Sources
| Source | Indicators |
|---|---|
| World Bank | GDP, growth, Gini, sector shares, internet/mobile/broadband, R&D, urbanisation, age structure, women in parliament, female labour & entrepreneurship, unemployment, new-business density, ICT & high-tech exports, account ownership, remittances |
| UNDP HDR 2025 | HDI, IHDI, Gender Inequality Index & components, Gender Development Index, education years |
| V-Dem / OWID | liberal & electoral democracy; Corruption Perceptions Index; press freedom; median age; religiosity; trust; life satisfaction |
| World Bank Data360 | Worldwide Governance Indicators; IMF AI Preparedness Index |
| Hofstede · EF | individualism, uncertainty avoidance, long-term orientation; English Proficiency Index |
Citing the source
Huang, S., Carter, S., Eaton, J., Pollack, S., Callender III, D., Makagiansar, N., Gonzalez, M., Carr, S., Hong, J., Handa, K., McCain, M., Millar, T., Julapalli, M., Yun, G., Alt, A.J., Larsson, C., Leibrock, J., Gallivan, M., Sumers, T., Durmus, E., Kearney, M., Shen, J.H., Clark, J., Stern, M., & Ganguli, D. (2026, March 18). What 81,000 People Want from AI. Anthropic. anthropic.com/features/81k-interviews
Caveats. Country-level correlations, not causal claims (subject to the ecological fallacy, since country patterns are not individual behaviour). Predictors co-move with development, so rely on the partial-correlation and Shapley sections, not the raw ranking. Per-country samples are uneven (~21,000 to a handful). Weighting mitigates but doesn't erase this, and significance uses country counts. Unmeasured confounders remain: media/elite AI-risk discourse, survey-language framing, and who selects into being interviewed. Extra drivers (median age, digital-finance leapfrogging, English proficiency, individualism, entrepreneurship, ICT exports, youth unemployment) were surfaced by cross-checking the hypothesis list with several frontier models.
Further reading: the mobile-phone evidence
- Suri, T., & Jack, W. (2016). The long-run poverty and gender impacts of mobile money. Science, 354(6317), 1288–1292. science.org. Kenya's M-PESA lifted ~194,000 households out of poverty, with gains concentrated among female-headed households moving from farming into business.
- Aker, J. C., & Mbiti, I. M. (2010). Mobile phones and economic development in Africa. Journal of Economic Perspectives, 24(3), 207–232.
- Aker, J. C., Boumnijel, R., McClelland, A., & Tierney, N. (2016). Payment mechanisms and antipoverty programs: evidence from a mobile money cash transfer experiment in Niger. Economic Development and Cultural Change, 65(1). journals.uchicago.edu. Paying transfers by mobile shifted control toward women.