AI & society
I Reverse-Engineered the ALICE Methodology with Fable 5
Four counties do not cost the same, and costs do not hold still for six years.
The numbers below come from my own independent reconstruction of the United For ALICE methodology (I call it the Reconstructed ALICE Series). They are not United For ALICE's official figures.
Four counties, one identical number, six years
The most widely used measure of financial hardship in Hawaii is the ALICE threshold, published by United For ALICE, a research arm of United Way. It answers this question: what does a bare-minimum household budget cost here — housing, child care, food, transportation, health care, a basic phone plan, and taxes — and how many households cannot cover it? That is a more practical measure than the federal poverty line, which was never designed for a state where rent alone can exceed the poverty threshold.
While using these numbers in a modeling project, I noticed something odd. Honolulu's published survival threshold was exactly $75,000 in every report year from 2016 through 2021. So was Kauai's. Maui printed the same $75,000 from 2018, and Hawaii County from 2019. By 2021, all four counties reported the identical number, for years running, while everything we know about their actual costs was moving apart.
That bothered me. Four counties do not cost the same, and costs do not hold still for six years. So I started reading their methodology documents to find out what these numbers actually measure.
What went wrong in the published numbers
To be clear about one thing first: United For ALICE publishes its method openly and gives away its county data for free. Everything I describe below was possible only because of that openness, and the problem I found is not a scandal. It is a measurement artifact, and their newest method actually fixes it.
Before 2022, published thresholds were rounded to a short list of preset income levels. Near the top of that list, the levels were $25,000 apart. A county whose real survival budget rose from $76,000 to $89,000 would print $75,000 both years. The rounding made it impossible to reflect actual changes in the real world, so the published numbers stayed the same while real costs increased. Then, starting with the 2022 data year, thresholds switched to exact dollars, and all of the accumulated change appeared at once. In the published series this looks like years of no change followed by a sudden increase.
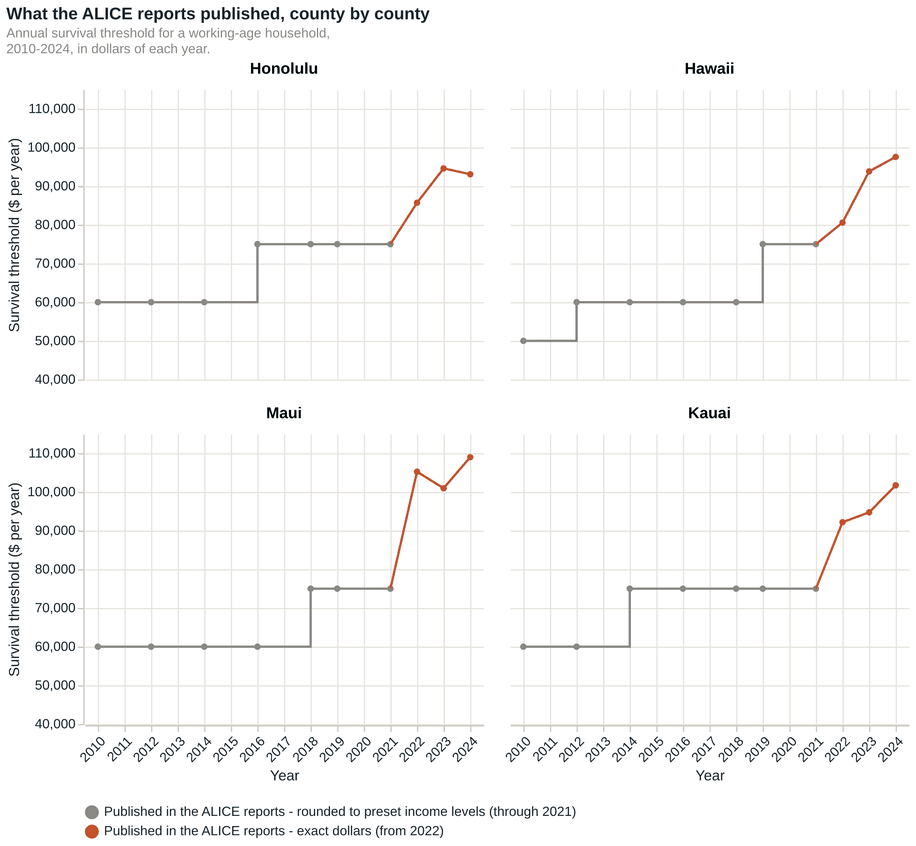
The published thresholds, as printed. All four counties sat at exactly $75,000 by 2021, then jumped when exact-dollar reporting began.
The problem is that the reports print the old rounded years and the new exact years as one continuous line. Nothing in the chart tells a reader that the measuring method changed underneath it unless they read the reports carefully. Read as one line, it says hardship was stable for a decade and then exploded. This could lead the readers to misunderstand what's actually happening.
Why I decided to rebuild the method
The obvious fix would be for the publisher to restate the old years under the new method. They have not, and their published files show that no pre-2022 number has ever been revised. So the past, as published, stays on the old rounding. I can't blame them; it's a daunting task for humans.
But I saw there was a way to solve it. The general idea, not details, of the current methodology is documented, and the outputs are published for roughly three thousand counties. With that many published answers and a documented set of rules, I thought I might be able to reverse-engineer the methodology with the help of Fable 5, the most advanced AI at the time. So that is what I did.
How the reverse-engineering worked
The rules fell into three groups. Some were stated in the documents and could be implemented directly, like the housing rule (110% of the federal Fair Market Rent standard) and the child care rule (the 75th-percentile licensed family child care rate, which Hawaii conveniently surveys by county). Some rules were not stated anywhere but could be recovered from the published numbers themselves. One example: the methodology says the food data is one year old, but the published numbers only match if it is two years old. With enough counties, questions like that stop being guesses; the data settles them. The third group, the part we genuinely had to estimate, ended up small: two cost components whose sources sit behind paywalls, one scale factor on food, and the tax calculation, which we rebuilt from actual tax law because their tax engine cannot be run on the past at all.
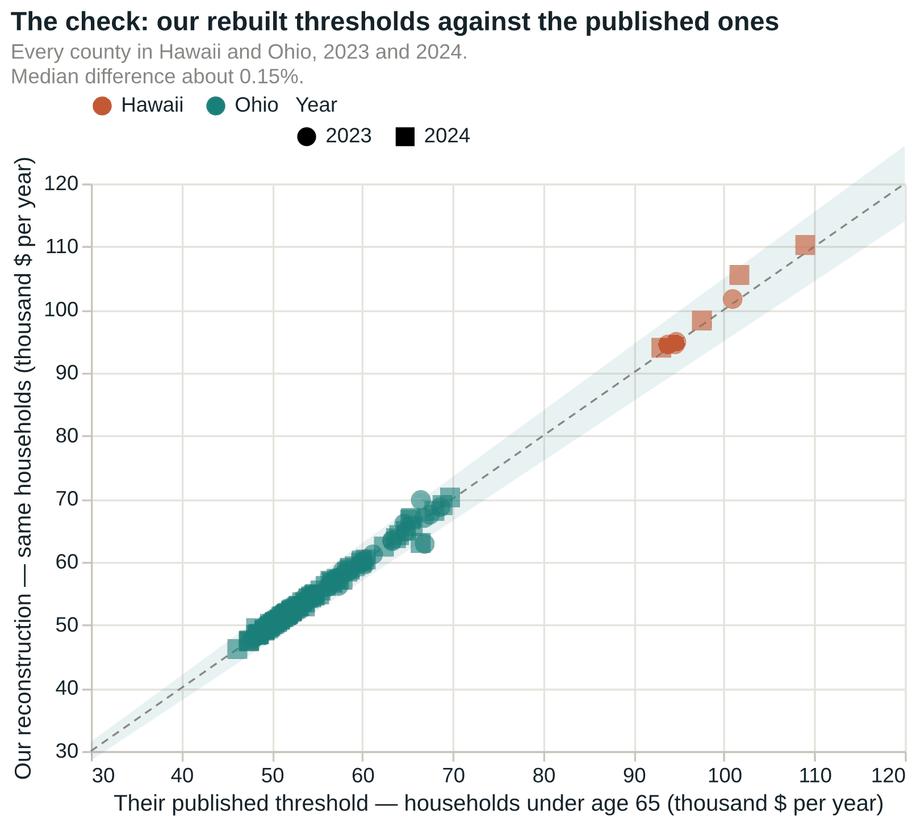
The check: my rebuilt thresholds against the published ones, every county in Hawaii and Ohio, 2023 and 2024. Median difference: about 0.15%.
As it turns out, the rebuild reproduces their published thresholds with a median error of about 0.15% across 93 counties. When I applied it to a year it was never fitted to, it came within about 2.3%.
A fair question about this chart: if the method was actually reverse-engineered, why are a few points off the line at all? The answer is that every gap has its own reason. The budget's internal arithmetic reproduces to the exact dollar. Housing, child care, health care, and the technology line land exactly on the published values, county after county. The remaining gap comes from parts I substituted knowingly, not parts I failed to solve: the tax line is my own rebuild from actual tax law, because their tax calculator cannot be applied to past years at all (although it still agrees within about 1.3%), and the food line is deliberately built up from public source data rather than copied from their answers, and it carries real measurement error of about 0.3%. The few visible outliers are small counties where a single input is hard to pin down, and in the worst case (one Kauai year) I can even say why: their published number implies an internal data-quality rule replaced that county's household-size input, and the replacement value is not published anywhere.
In fact, a reconstruction that matched perfectly everywhere would be a bad sign. It would mean I had copied their numbers instead of rebuilding the method that produces them. The pattern here is the one a successful reverse-engineering should show: exact agreement wherever the rules are fully recovered, and small, fully accounted-for differences exactly where I swapped in a public source for a closed one. At that point, I told Fable 5 the reconstruction was good enough to run backwards.
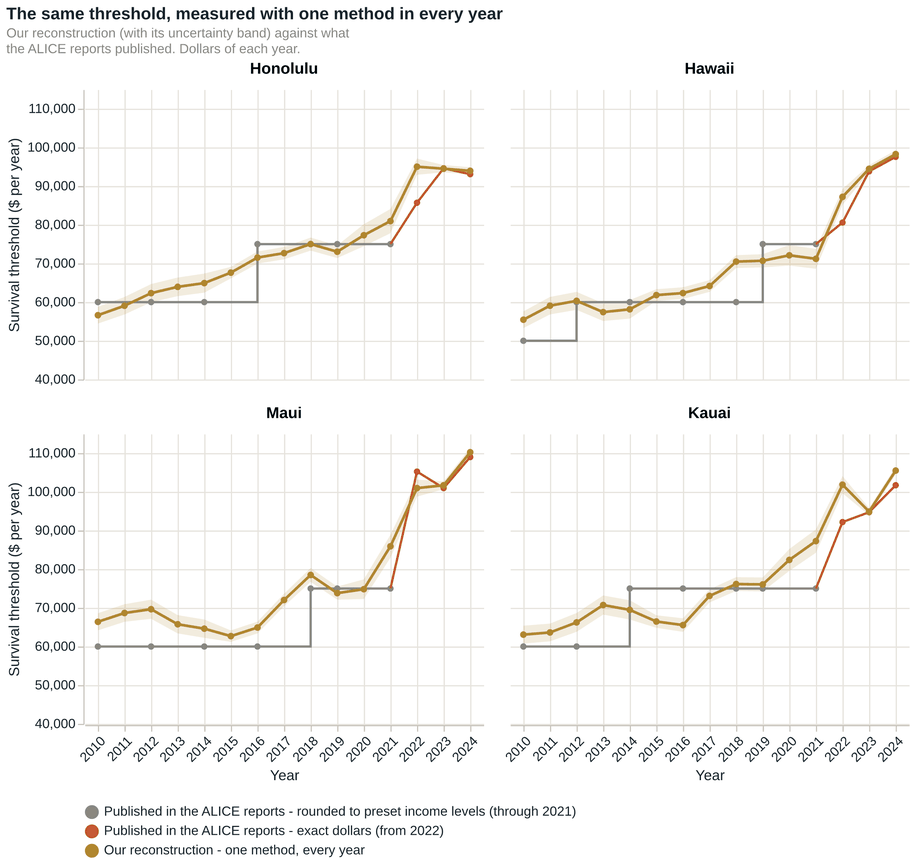
Each county's published thresholds (flat steps through 2021, exact dollars after) against the same threshold measured with one method in every year.
The chart above shows the whole difference at once. The stepped line is what was published. The continuous line is the same measurement, taken the same way, every year. While all four counties printed $75,000, their real budgets were thousands of dollars apart — in both directions. Kauai's was understated by about $9,000 and Hawaii County's overstated by about $6,000, at the same printed number, and that's justifiable as stated earlier.
What one consistent measurement shows
One more correction mattered, and we caught this one in our own numbers: ALICE publishes two budgets, a working-age budget and a lower senior budget, and a third of Hawaii's household heads are now 65 or older. If you measure every household using the working-age budget, the hardship trend roughly doubles, not because life got harder but because Hawaii aged. We had to account for that, and we corrected our own numbers more than once before finally reaching the chart below.
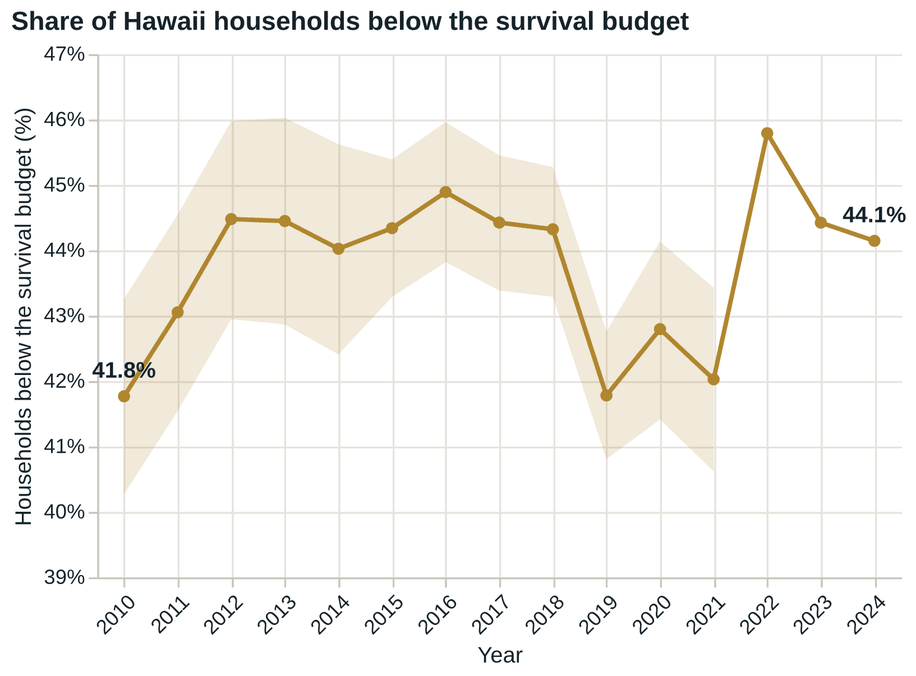
Share of Hawaii households below the survival budget, measured with one method and each household scored against the budget for its age group.
Measured finally in the correct way, the share of Hawaii households that cannot cover a bare-minimum budget went from 41.8% in 2010 to 44.1% in 2024, peaking near 46% in the 2022 cost spike. The published reports' own counts show +2.0 points from 2010 to 2023. Mine shows +2.7 over those same years, and +2.4 if you run it through 2024. The two now differ mainly in the measuring method itself, which is exactly what a reconstruction should say.
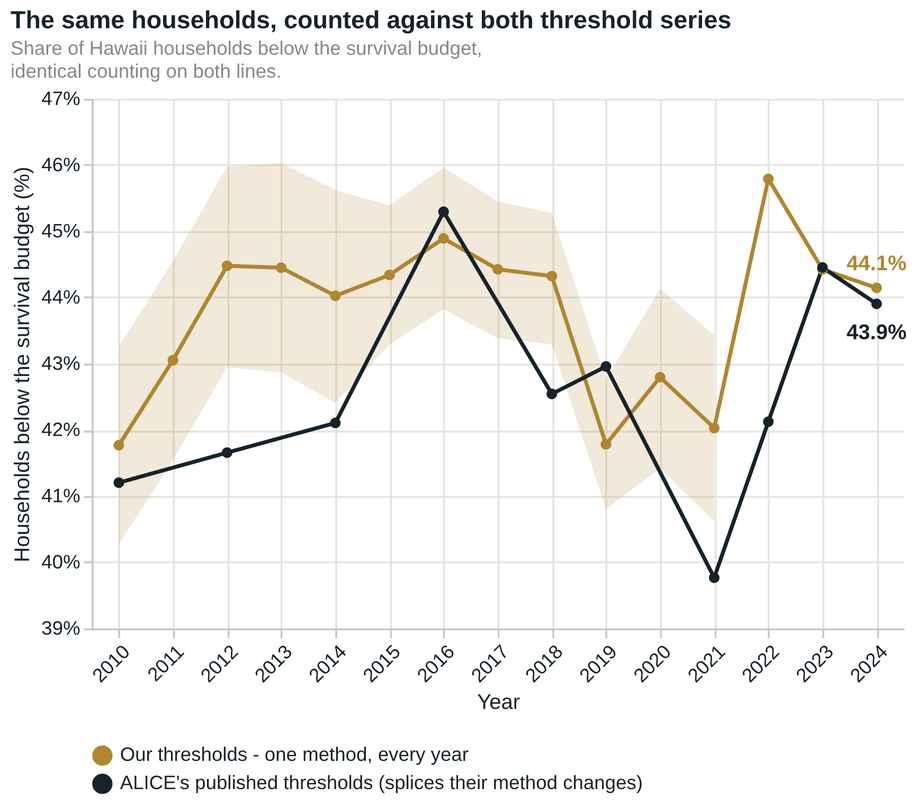
The same households, counted the same way, against the two threshold series. The only difference between the lines is the measuring method.
A few findings underneath the statewide number. Hardship among senior households, measured against their own budget, actually improved: 47% below the line in 2010, about 42% in 2024. And the counties tell different stories.
So that's the story of the state of Hawaii, but if you know Hawaii beyond Oahu, different islands have different stories.
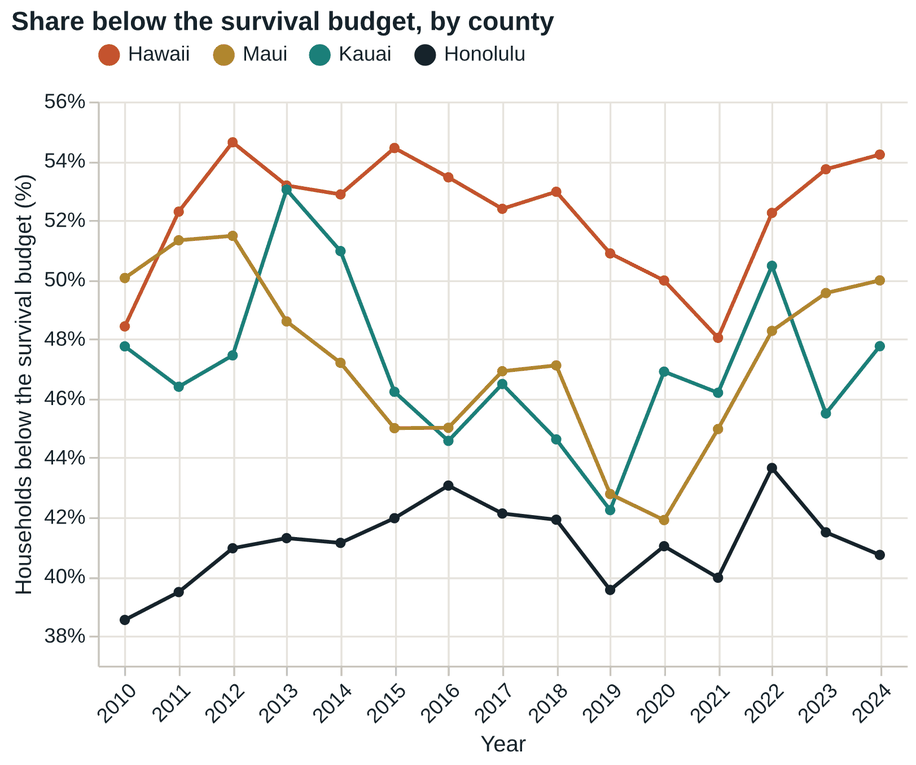
Share of households below the survival budget, by county.
Hawaii County worsened from 48% to 54% and is still rising. Maui fell, then rose sharply after 2021, and ended the period where it began. Kauai fluctuates but ends where it started. Honolulu is lowest, and because it holds two-thirds of the state's households, its smaller increase is the main reason the statewide figure understates what most of the islands experience.
You can tell from this figure that four counties indeed have different stories, but even within the same county different municipalities have totally different stories as is the case for other states in the United States, and most of those stories have never been visible before. The ALICE reports publish community numbers for a single year only, a snapshot with no past. I ran the series for every Census-mapped community in Hawaii: 166 towns and neighborhoods, 15 years each. Some Puna-side communities on Hawaii Island, for example, have had more than nine in ten households below the line for years. East Honolulu sits near one in four. Those two places are in the same state, and both are counted in the same statewide number.
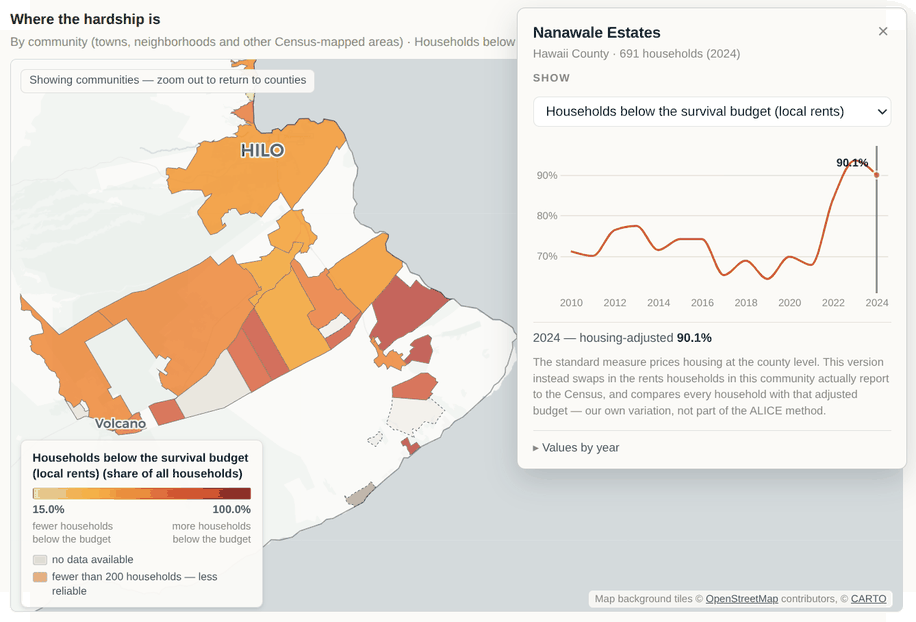
From my interactive map: the Hilo and Puna areas of Hawaii Island, with each community's own fifteen-year series a click away. In Nanawale Estates, nine in ten households sit below the survival budget once housing costs are adjusted to the rents people there actually pay.
That level of detail deserves its own post.
So did United For ALICE get it wrong?
No, not at all. Far from it. Their threshold levels are right; I reproduce them. Their switch to exact dollars was an improvement; it reveals change the old rounding could not show. The failure is narrower and more common than an error: a method changed; the past was never restated, and the old and new numbers are still printed as one line. Most readers of a chart cannot know that. I would rather be superseded — if they ever publish a restated back series, mine should retire, and I would be happy to see it.
What this does not claim
My tax line is a substitute built from statute, not their calculation, and lands within about 1.3% of theirs in recent years. Two cost components are still calibrated to their published values because the underlying sources are paywalled. Every reconstructed year carries a stated uncertainty band, and the bands widen where the inputs are weakest. These are my numbers, with my error bars, offered so that anyone can check them. The technical notes carry the full accounting, including every rule I recovered, the tests the reconstruction has to pass, and the places where I could not get there.
None of this says Hawaii's hardship is worse than we believed, or better. It says the number now means one thing. More than four in ten households here cannot cover a bare-minimum budget. That was true under their measure and it is true under mine. The difference is that we can now see how it moved in the past and that tells a story.