Hawaii
Hawaii's Out-Migration Slowdown: Why it reveals a larger problem
Fewer people are leaving Hawaii. I checked who stopped leaving, and the answer is that almost nobody stopped. There are just fewer people left who can.
Hawaii's loss of people to the mainland is slowing, and it is tempting to read that as good news. I checked who stopped leaving, and the short answer is: almost nobody stopped. The people who leave still leave at the same rates as before. There are simply fewer of them left.
The number that did not make sense
Between 2022 and 2024, Hawaii's net loss of people to other states fell from about 0.8% of the population per year to about 0.1%. Read on its own, that looks like relief. Perhaps fewer families are being forced to leave by costs.
But the same years were the worst on record for housing costs. The ratio of a typical monthly housing payment to a typical income reached levels in 2022–25 far beyond anything in the previous decade.
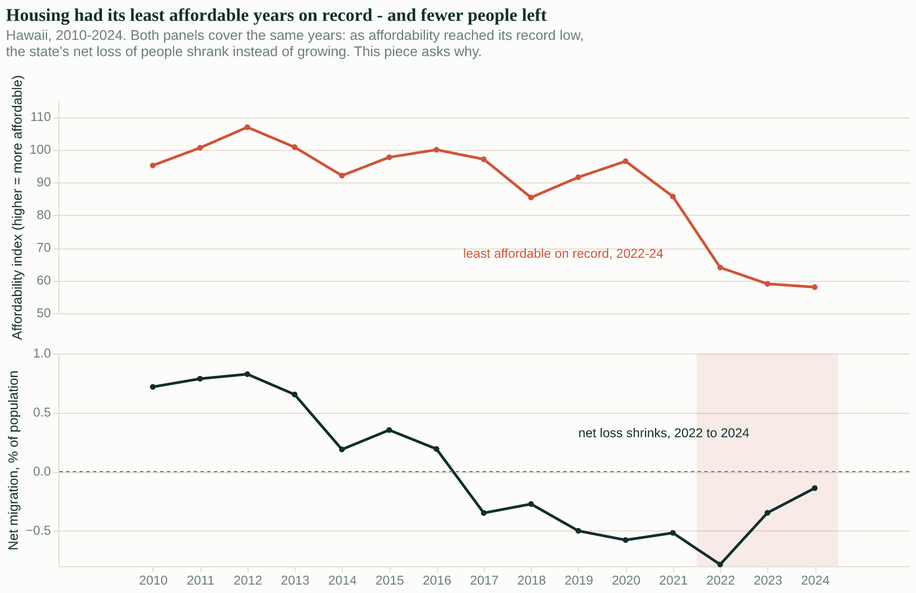
These two lines are the mystery this piece is about: the least affordable housing on record, and a shrinking loss of people, in the same three years.
Part of the improvement in the net number is about who arrived, and I come back to that. My subject is the other side: who leaves, and who no longer does.
Because on that side, the facts and common theory do not fit together. If leaving is how people respond to a place they can no longer afford, the worst affordability on record should have produced more leaving. Instead, there was less. Something had to be wrong in the usual story, the one where out-migration rises when Hawaii gets less affordable and falls when it recovers.
The explanation everyone reaches first
In national economics, the usual explanation for people moving less since 2022 is called mortgage lock-in: people who bought homes before 2022 hold mortgages at very low interest rates, selling would mean giving that rate up, so they stay. It is a real mechanism, measured by national research published in the Journal of Finance, and estimates from the Federal Housing Finance Agency rank Hawaii among the states where it should be strongest, because loans there are large.
The issue here is that the mechanism was measured mostly on mainland behavior, and the Hawaii ranking comes from the arithmetic of loan sizes. Nobody measured how Hawaii households actually behave. Hawaii differs in ways that matter for moving: leaving means crossing an ocean (which costs far more than moving within the mainland for most people, especially homeowners, who usually have more to ship), and its culture and family ties give people reasons to stay that a national average does not measure. A mechanism like this should be tested locally before it is assumed to explain anything about the islands.
The University of Hawaii Economic Research Organization (UHERO) described lock-in in its 2025 Housing Factbook as slowing home sales, without claiming it explains out-migration. Their own migration research instead reports that more Hawaii-born people are returning, and I come back to that below. I must admit that lock-in was the first explanation reached in my own project, too. I do this work with Anthropic's AI model Fable 5, and the AI initially concluded lock-in before I caught it.
My explanation, and where it came from
My hypothesis was different, and it came from my own history, so I should state its bias along with it. On the Big Island, I worked as a postdoctoral researcher at the University of Hawaii at Hilo. At the time I checked my salary against the ALICE threshold for that island, the bare-minimum household budget for housing, child care, food, transportation, health care, a phone plan and taxes, and mine was below it. Later, on Oahu, I worked as a scientist at a salary that was good by local standards, and still far below what the same job pays in the big mainland cities. Three years ago I moved to California, because I could, and my retirement savings improved dramatically. In other words, I am one of the people this piece is about: the ones who could solve their problem by moving, and did.
I should also say what the economics leaves out. Hawaii is a wonderful place to live for reasons that have nothing to do with money: its culture, and above all its people. Many people will "try" to stay, hard and for years, and many of those who eventually leave do so with sadness. So when I talk about the people who could leave, I am not saying leaving is the obvious choice, only that for some it is the one option that solves the money problem. And it means the leaving we observe understates how many people wanted to stay.
That history left me with a suspicion about the people still in the islands. Out-migration can fall for only two reasons: people leave less often, or there are fewer people left of the kind who leave. Lock-in is the first kind, and it depends on a calculation most people never make. I suspected the second kind, in two parts. First, that most of those who could leave the way I did have already gone: Hawaii's young people have been leaving at roughly twice the national rate for years, and each year the group able to leave gets smaller. Second, that those who remain are increasingly the ones who are stuck, still struggling, with no move that would fix it. If that is right, out-migration slowed because the leavers are depleted. Nobody's situation had to improve. The hardship stays in Hawaii, with the people who find it harder to leave.
One person's story is a biased sample, and mine has the particular bias of someone for whom leaving worked. That is why I wanted the answer from data rather than from my own memory. We wrote the pass and fail conditions down before examining the data, then measured, using three independent sources:
- The Internal Revenue Service's state-to-state migration records (built from tax returns, by income and age, 2011 through 2022),
- The Census Bureau's American Community Survey (which asks where people lived a year earlier, through 2024), and
- The Census Bureau's household-level survey sample. Each measures something slightly different, and I will keep them separate.
The people who leave still leave
In the IRS records, the share of each age and income group that left Hawaii stayed within 15% of its pre-pandemic (2015–19) average, in every group. No group's leaving rate fell by much, and the youngest group's rate ended the record at its highest level.
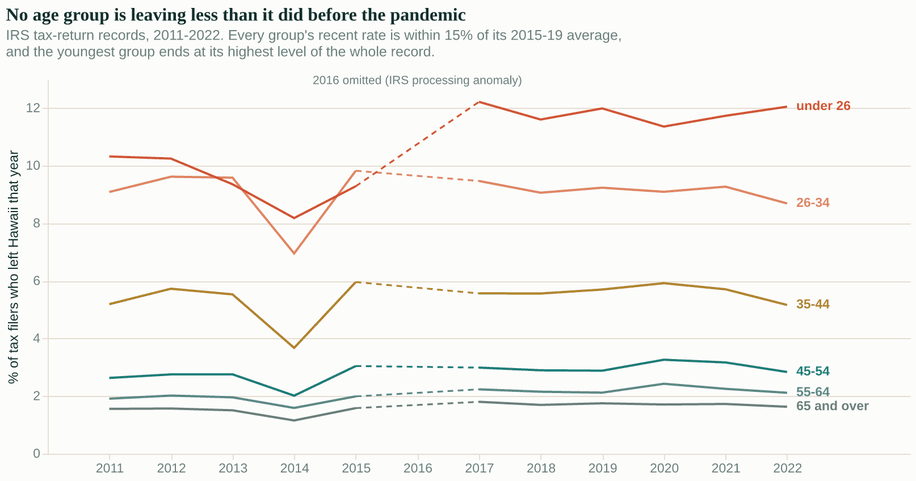
If people had stopped leaving, these lines would bend downward at the end. They do not.
The Census survey, which covers the years through 2024, shows the same thing for the group that matters most: Hawaii's 18-to-34-year-olds still moved away at about 9% per year in 2022–24. That is about twice the rate of the average state, essentially unchanged from before the pandemic.
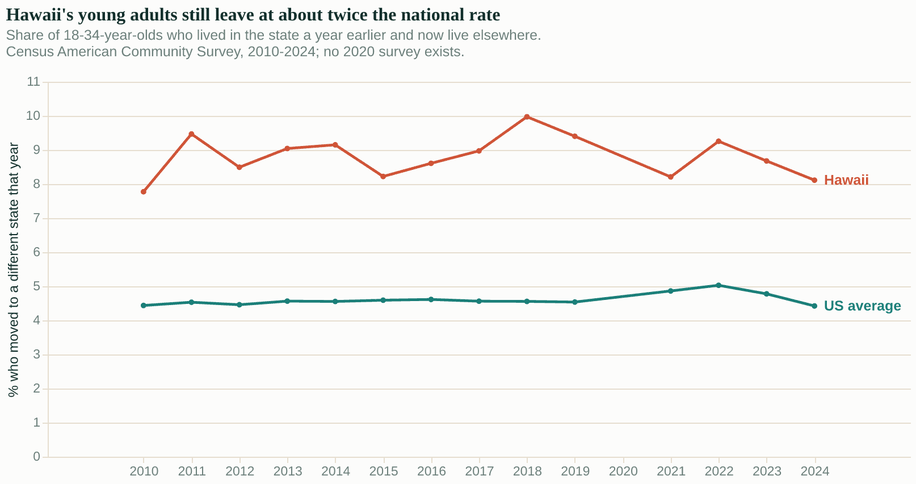
Young people are not leaving less. Their rate has been about twice the national one for the whole fifteen years.
These flat rates also answer a different explanation, one the Factbook's own rent numbers suggest: the mainland became expensive too. Hawaii's median rent premium over the national average narrowed from 53% in 2013 to 44% in 2023, and California median rents are now slightly above Hawaii's. If a narrowing cost gap were what reduced leaving, each group's leaving rate should have fallen as the gap narrowed. Outside the 55-and-over group, the rates did not fall.
But there are far fewer of them left
The share of Hawaii's population aged 18 to 34 fell by 3.7 percentage points between 2015 and 2024. The same share for the whole United States fell by 0.7 points. Hawaii's supply of the people most likely to leave shrank about five times faster than the nation's.
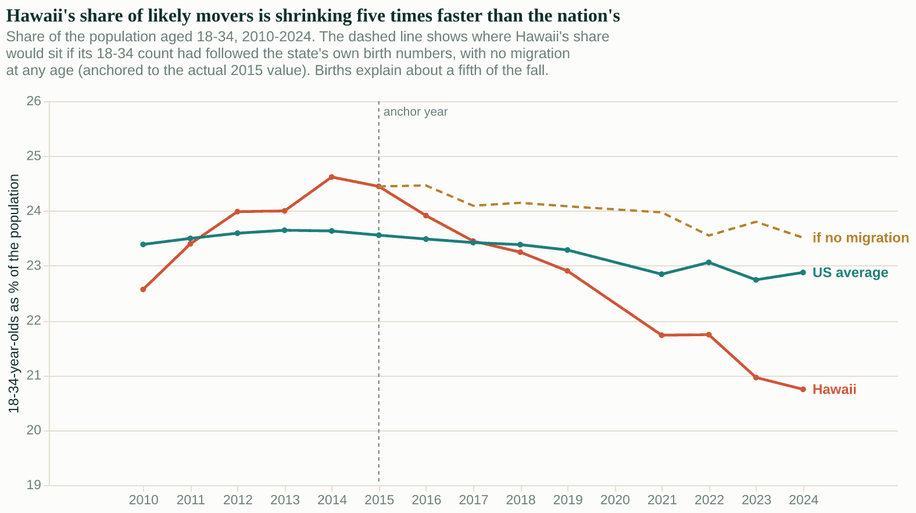
This is the depletion itself. By its own birth numbers, Hawaii would still be a young state, above the national average. The gap between the dashed line and the actual one is migration: people who left, and people who never came. Smaller birth cohorts explain only about a fifth of the fall.
Here is a simple way to see what that does to the statewide total. Suppose nobody's behavior had changed at all, and every age group kept leaving at exactly its old rate. Hawaii's out-migration would still have fallen, because the population now contains fewer young adults and more seniors. That arithmetic alone accounts for about 60% of the actual decline between 2015–19 and 2022–24. The remaining 40% is real behavior change, but it comes from an unexpected group: seniors, who were already the least likely to leave, became about 13% less likely still. Young adults' behavior barely changed. So neither part of the decline says anything about working-age families finding it easier to stay.
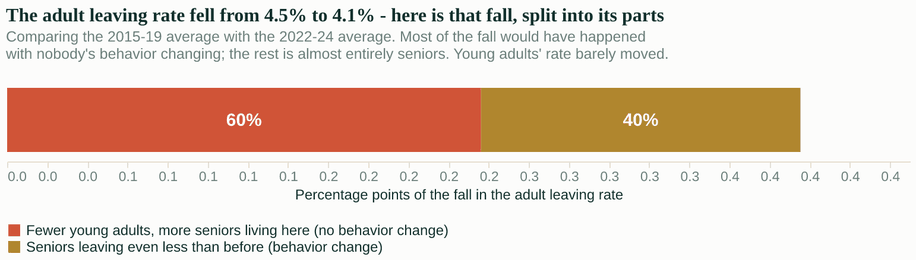
Neither piece of this bar is working-age families deciding to stay.
The lock-in signature was not found where it should be
If cheap mortgages were what kept people in Hawaii, the drop in leaving should be concentrated among homeowners. It is not. Comparing each group's 2022–24 average with its 2015–19 average: homeowners left at essentially their pre-pandemic rate (2.88% per year then, 2.78% now, a difference inside the survey's margin of error), while renter departures genuinely fell, by 8.6% in rate and 17% in yearly count, beyond the margin of error. Renters have no mortgage to be locked into.
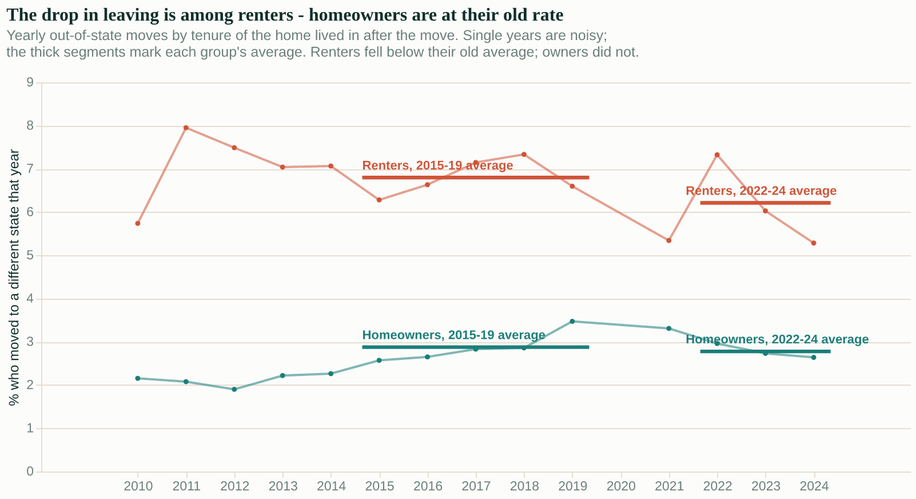
The group with mortgages behaves the same as before. The group without them is the one leaving less, the reverse of what lock-in predicts.
One measurement problem needs attention here. The survey records the home a mover lives in after the move, so a Hawaii owner who sells at record prices and rents on the mainland while looking for a house is counted as a renter mover. Note the direction of that error: it places owners who sold in the renter line. The renter line is still the one that fell. If anything, the true renter decline is larger than measured, and the true owner outflow larger still.
A reader holding the age chart and the tenure chart side by side will also ask: if young adults' rates barely moved, who are the renters leaving less? The public tables cannot cross age with tenure, so I cannot answer directly. The two breakdowns are consistent if the decline is among older renters, or if the renter population itself aged, and part of the renter count decline is simply the renter population shrinking, by 9.3% over the same comparison. What the tables do rule out is the pattern lock-in requires: a decline concentrated among owners.
Two more measurements support the same conclusion, and both are the opposite of lock-in.
- In the IRS records, the share of the highest-earning filers (over $200,000) who left Hawaii rose 14% compared with before the pandemic. Those records end with the 2022 filings, so they mostly predate high mortgage rates and count as early evidence.
- In the household sample, which covers later years, the share of leaving households that owns its home at the destination rose from 28% to 39% between 2015–19 and 2019–23. Buying a mainland home within a year of arriving takes money, and for Hawaii leavers the most common source of that money is a Hawaii home they sold. (Five-year pools are the form the Census releases that sample in, and 2019–23 is the newest, which is why its window differs from the comparisons above.)
A locked-in owner does not leave more; an owner selling a Hawaii home at record prices, and leaving with the money, does. The same market that was supposed to keep owners in place made selling and leaving more rewarding than it has ever been.
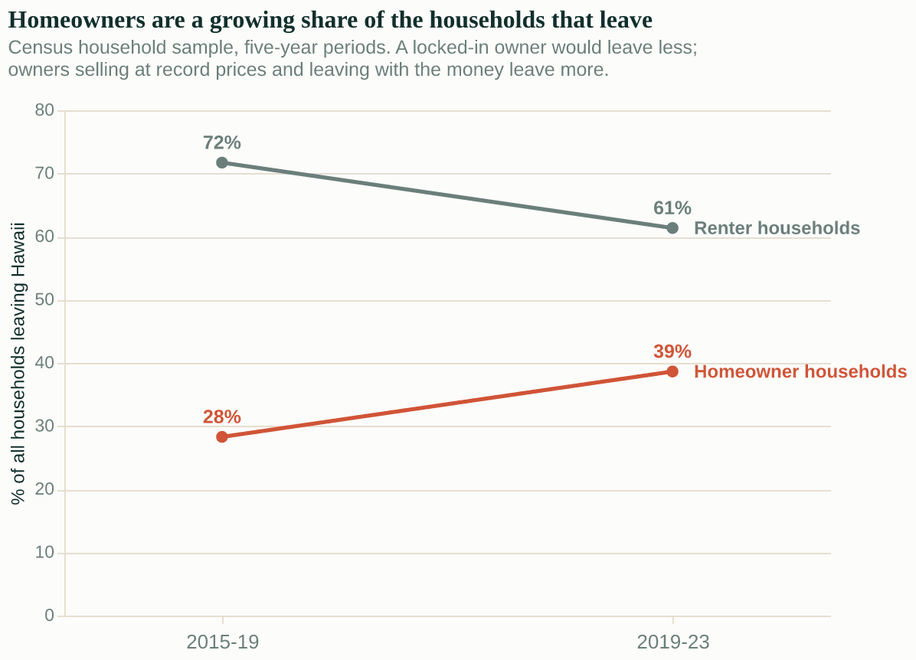
Owners are not trapped in Hawaii by their mortgages. A growing share of them are selling and going.
What the people who remain look like
Fifteen years of this should leave a visible result in who still lives in Hawaii, and it does. Between 2010 and 2024, the share of Hawaii households headed by someone 65 or older grew 4.3 percentage points more than the national share did. The share who own their homes grew 3.8 points more over the same 2010–2024 window (nationally, that share barely moved). The population left behind is older, with more homeowners, than aging alone would make it, which is what years of selectively losing the young and the renters should produce.
A fair question: is this not just Hawaii aging? Comparing against the national change removes the part of aging the whole country shares. It does not remove everything specific to Hawaii. The state's life expectancy is the highest in the nation, its birth rate has fallen more than the nation's, and both also increase those shares. I have not measured how much each contributes. The direct evidence for depletion is in the migration flows themselves. The population shares are the accumulated result being where they should be if the flows are right.
I should also be fair to the good news that does exist. UHERO reported that in 2023, more Hawaii-born people moved back to the state than left it, with the net gains concentrated at ages 25 to 44. People leave young, and some return mid-career. That finding and mine are not in conflict. Theirs is about who came in and mine is about who went out. Both can be true, and in the IRS records, both are.
None of this says people should leave, or that Hawaii is better or worse than the number suggests. All I am saying is that the improvement in Hawaii's out-migration statistics is not evidence that staying became easier. The number improved because fewer of the people who leave are left — and the ones who remain, remain with the same problem.
Appendix: what this does not claim
- Lock-in is "not found," which is not the same as disproved. The one group whose leaving rate genuinely fell is people 55 and over, and no public table crosses age with home ownership, so lock-in could be operating inside that group, indistinguishable from ordinary aging in place.
- The IRS data counts tax filers instead of people, and ends in 2022.
- The Census survey records the home a mover lives in only after the move. The home in Hawaii is never recorded.
- The household sample for Hawaii is small, and single years in it are noisy. Every number in this piece states the years it covers, and the comparisons use multi-year averages for exactly that reason.
- One caution applies to the opening chart only: recent Census methodology changes for counting international migration may overstate the net improvement in 2021–24. My analysis is of the leaving side, which those changes do not affect.